School Habitat Investigation - Physical Conditions and Plant Growth
Year 6 Biological Science Unit Plan
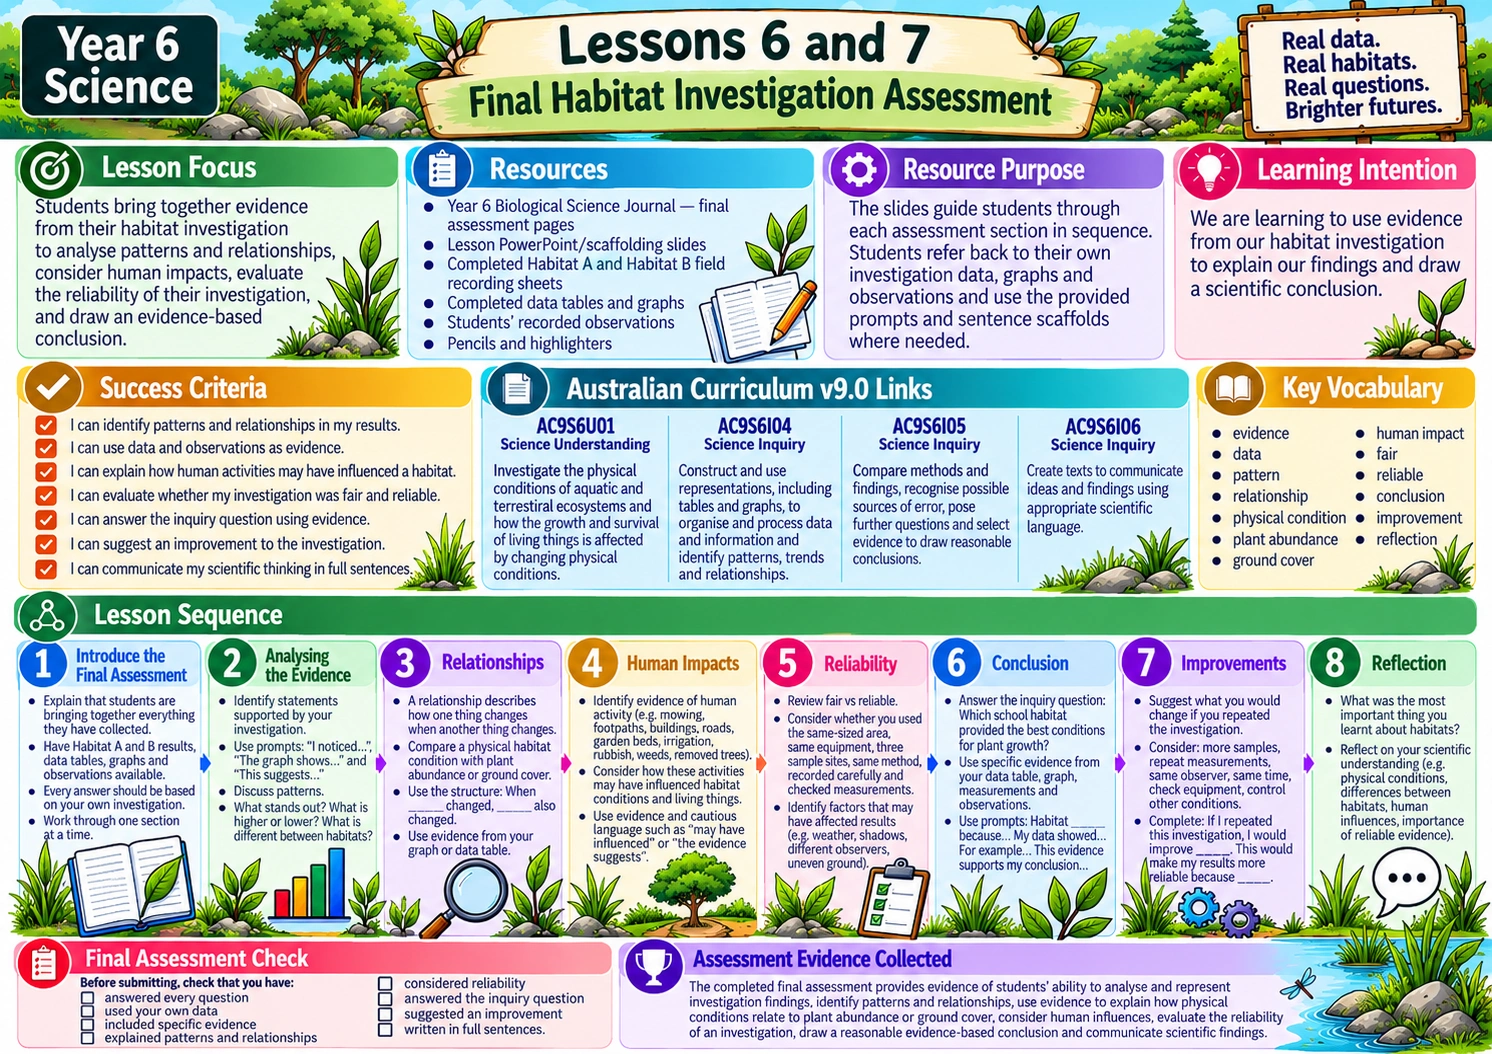
Students become habitat field scientists and investigate two terrestrial habitats within the school grounds. They identify and classify habitats, plan a fair and repeatable investigation, collect measurements and observations from three sample sites in each habitat, organise and graph data, analyse patterns and relationships, consider human impacts, evaluate reliability and use evidence to conclude which habitat provides the best conditions for plant growth, abundance and ground cover.
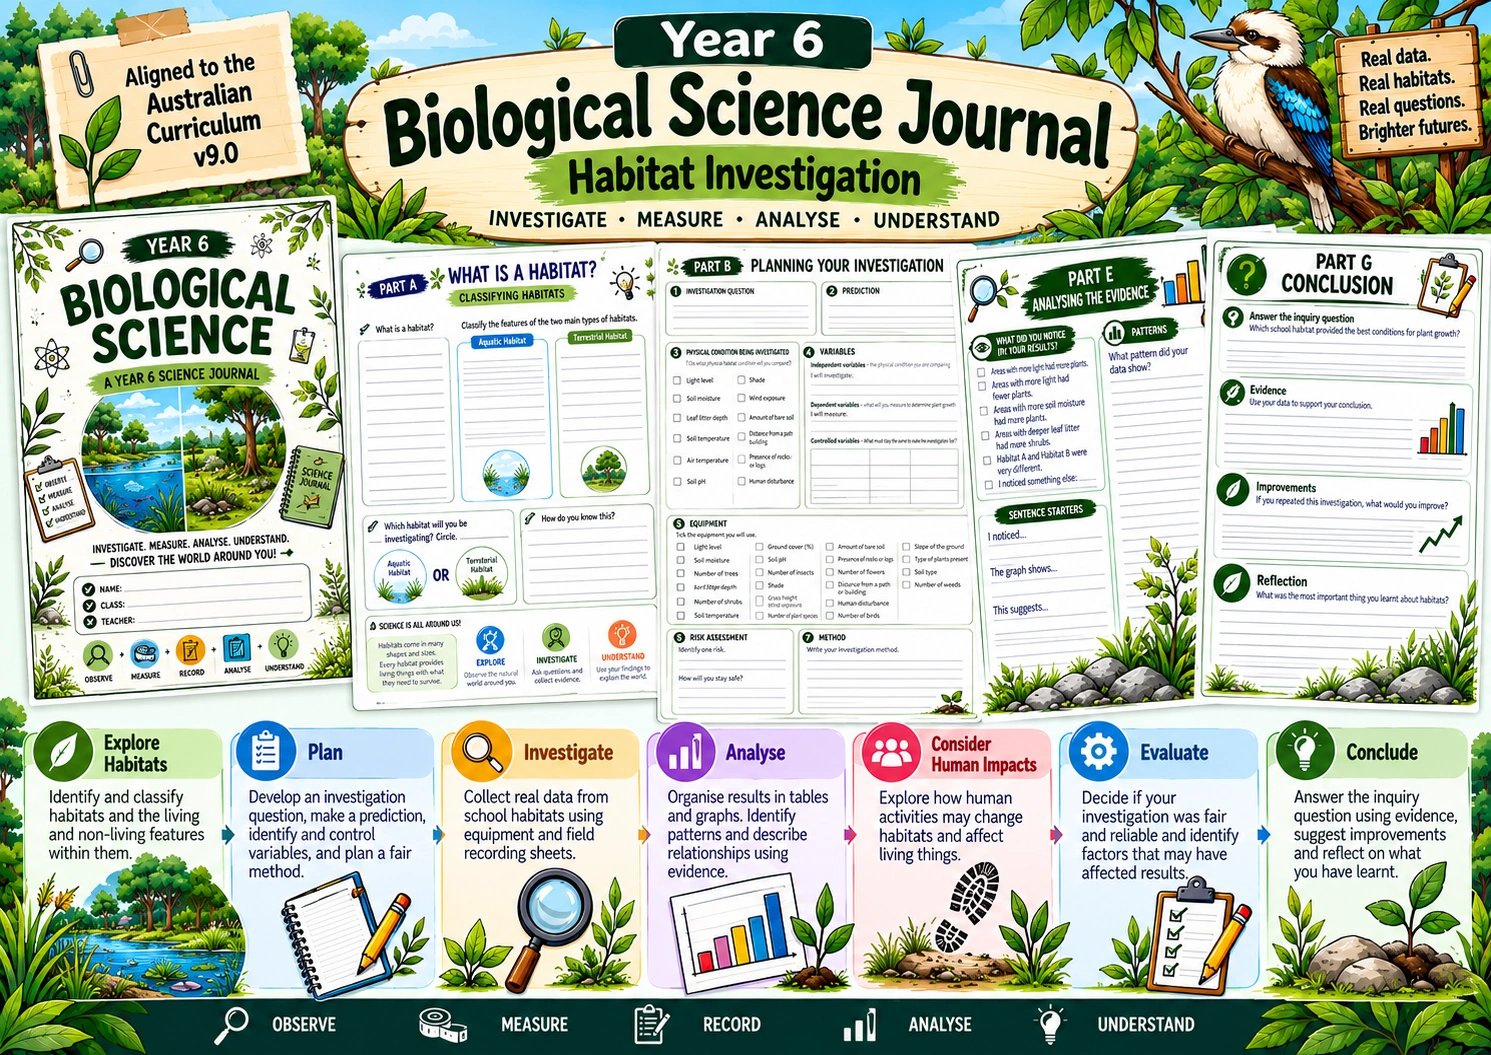
Year 6 Biological Science Journal
This Year 6 Biological Science Journal guides students through a hands-on investigation of school habitats, aligned with the Australian Curriculum v9.0. Students plan and conduct a habitat investigation, collect and graph real data, identify patterns and relationships, consider human impacts, evaluate reliability, and use evidence to draw a scientific conclusion.
Year 6 Biological Science Teacher Booklet
The Teacher Booklet provides everything needed to confidently teach the Year 6 Biological Science habitat investigation from beginning to end. It includes the unit overview, Australian Curriculum v9.0 links, learning intentions, success criteria, key vocabulary, resources, lesson guidance and assessment support.
Use the booklet alongside the Student Science Journal and lesson slides. Each lesson guides you through what to teach, the resources to use and how students progress through their investigation. The slides provide visual instruction and scaffolding, while the journal is where students plan, record data, analyse evidence and complete their final assessment.
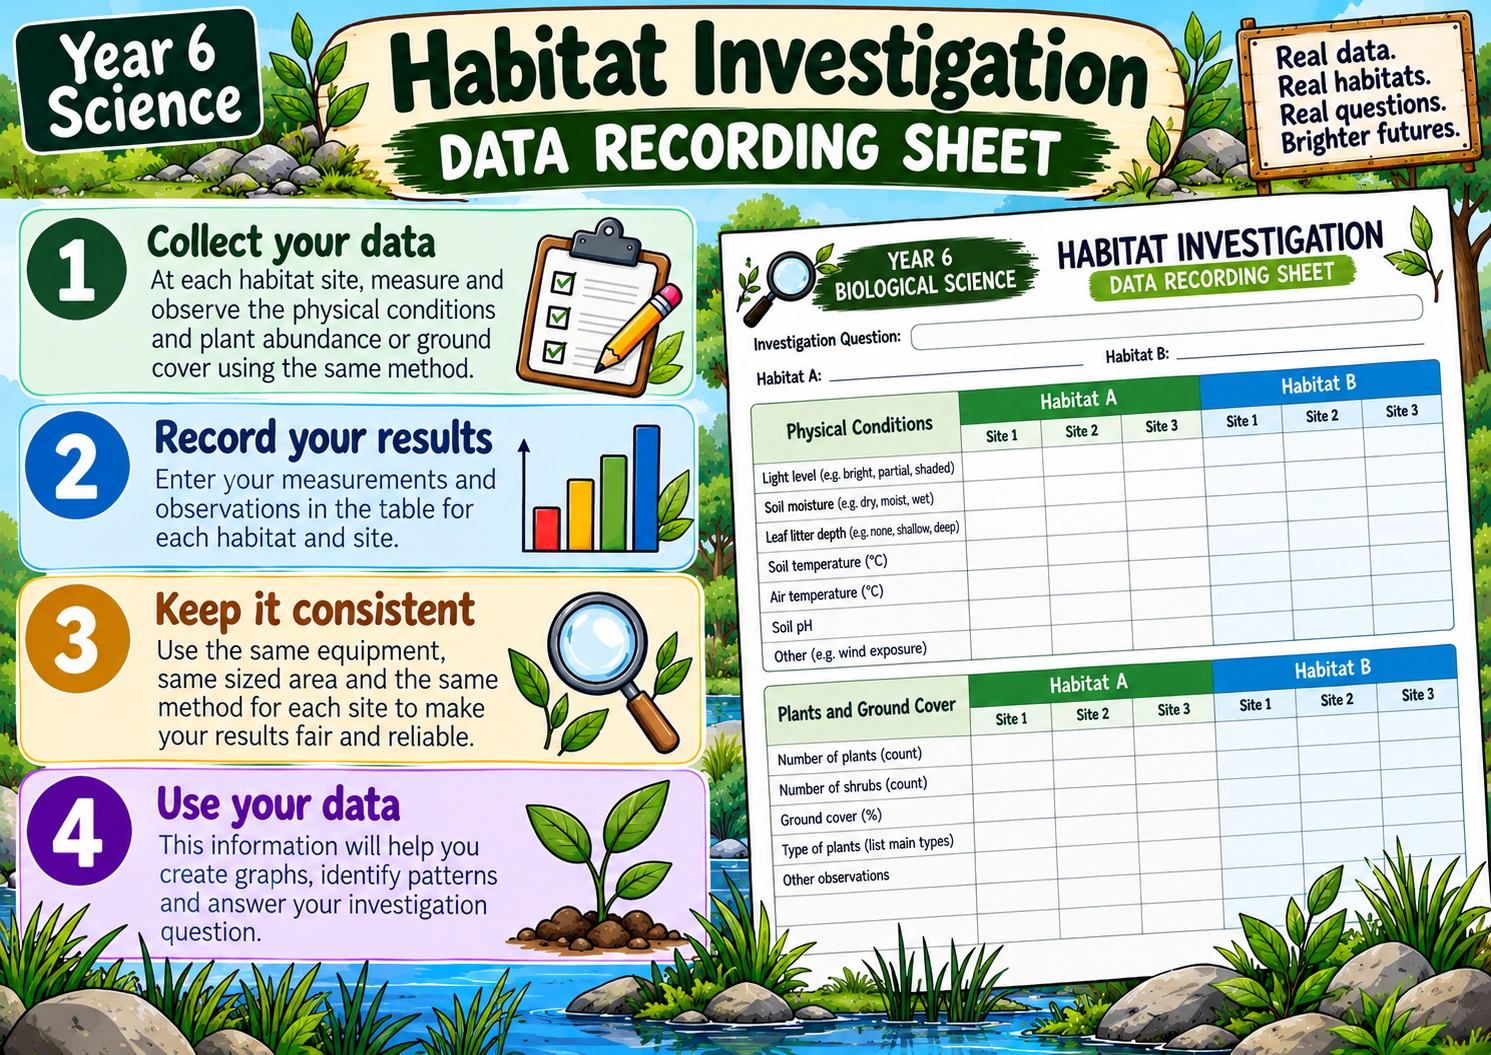
Habitat Investigation Data and Graphs
Students use the Year 6 Habitat Investigation Data and Graphs document to enter the data collected during their Habitat A and Habitat B field investigations. The spreadsheet helps students organise their results, compare the two habitats and create graphs to identify